Once you have launched your Responsive Ads campaigns, you can access Responsive Ads Reports and Charts to give you meaningful insights into their performance.
Responsive Ads Reports
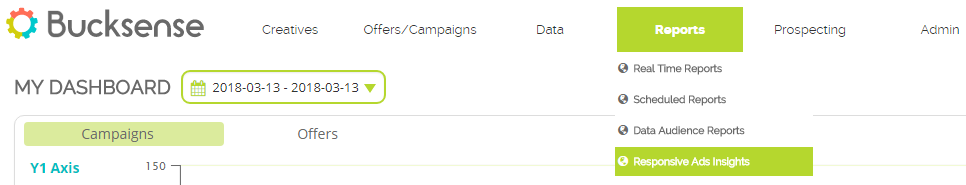
To access Responsive Ads reports, simply click on the Reports tab and select Responsive Ads Insights.
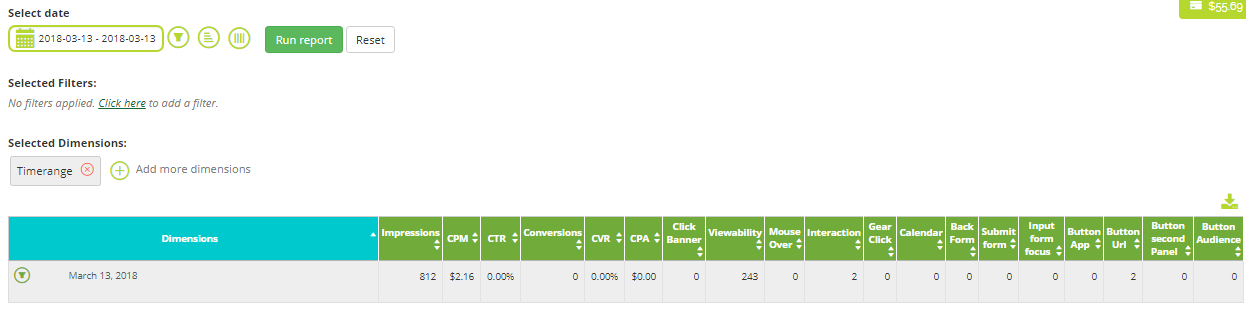
Click Select date to define a the period of time and the time zone you want to view your data. Under Select Granularity, choose how campaign data is displayed in report table: grouped by time interval or by hour, day or month.
Filters ![]() allow you to search for specific data by multiple parameters: offer, campaign, device, country, etc.
allow you to search for specific data by multiple parameters: offer, campaign, device, country, etc.
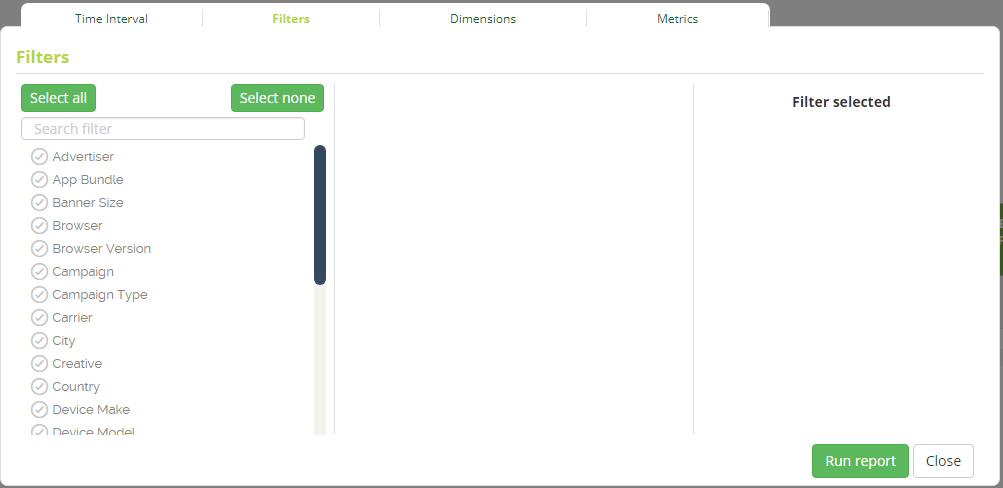
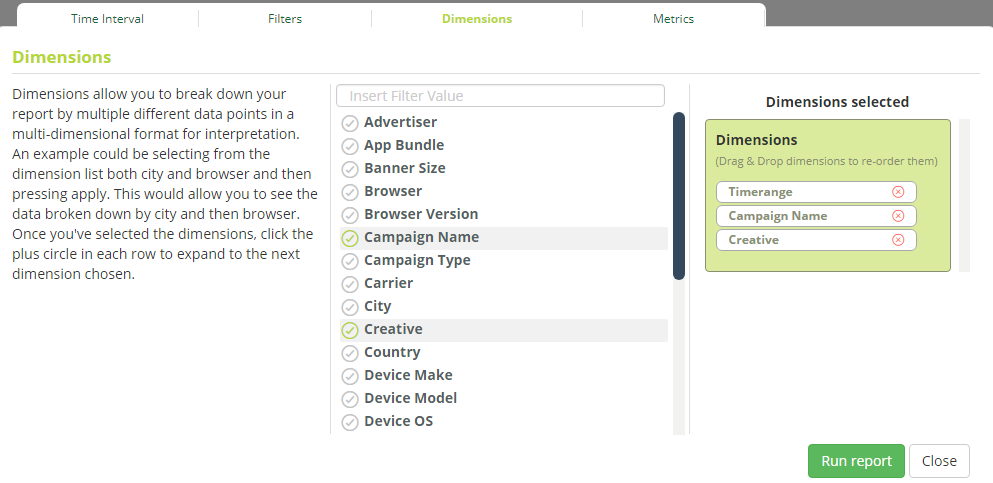
Dimensions ![]() allow you to break down your report by multiple different data points in a multi-dimensional formats: by city, country, browser, etc.
allow you to break down your report by multiple different data points in a multi-dimensional formats: by city, country, browser, etc.
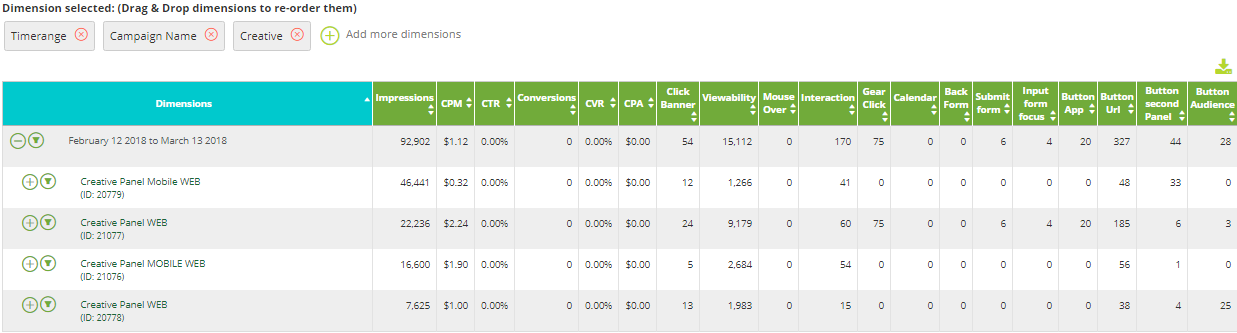
Select the dimensions that will help you to check the performances of your Responsive Ads. For example, first select Campaign Name, then Creative.
Breaking down reports this way will give you a comprehensive view of your campaign performance to make decisions that enhance its optimization.
The report will show you quantifiable data in different columns, providing detailed spending data with all the KPI (Impressions, CPM, CTR, Conversions, CVR, CPA), and, a set of metrics related to the user behaviour with your Responsive Ads (Mouse Over, Gear click, Calendar, Button url, Button second panel etc).
Responsive Ads Charts
Responsive Ads charts can be accessed by taking the following steps:
- Click on the Creatives tab and select Responsive Ads
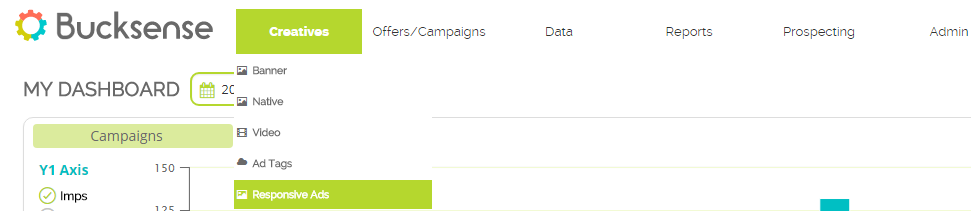
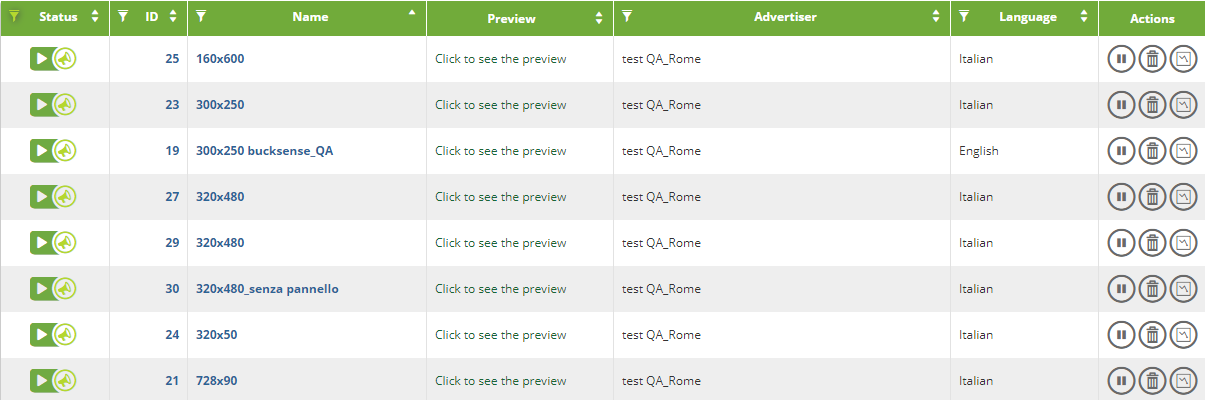
- A list of the Responsive Ads you have created will appear.
In the Actions column, click on the charts icon for the Responsive Ad you want to see.
At the top, you can view:
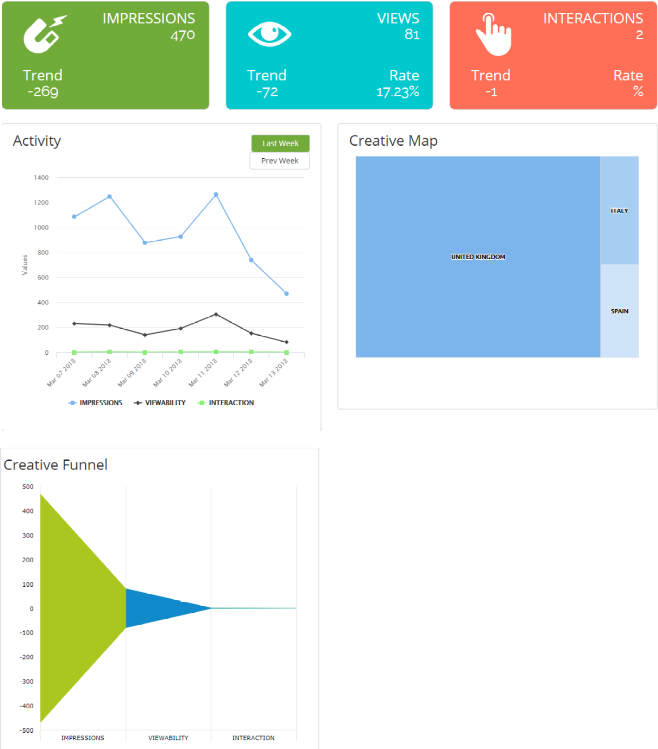
- the total number of IMPRESSIONS for the day and the Trend compared to the previous day
- the total number of VIEWS for the day, the difference with the previous day (Trend) and the Rate (Views/Impressions)
- the number of actions performed by users on your Responsive Ad (INTERACTIONS)
The Activity chart shows you the values described above for the current week (Last Week button selected by default). If you want to see the data for the previous week, just click on Prev Week button.
Creative Map shows you informations about the country distribution of users who have seen your Responsive Ads.
Creative Funnel provides a funnel chart showing the number of Interactions generated by the viewability (number of views) and the related impressions for the current day.