The Bucksense Optimization Algorithm has been conceived with the purpose of evaluating and analyzing the performance of multiple variables, and so achieve the performance goals of the campaign (see here how the Optimizer functions)
As soon as the Campaign (Optimized) goes live, the Algorithm starts collecting and measuring placements data that are used to make decisions and predictions, such as which type of variables need to be kept out due to their poor performance. As a result, the Algorithm optimizes bidding according to the variables that do work or have a significant potential to improve the performance.
To run Bid Optimization Reports from Real Time Reports section, please follow these steps:
1. Click Reports Tab and select Real Time Reports from the dropdown list
2. Choose Bid Optimization as type of report and select/type the campaign name you want to run the Bid Optimization Report for
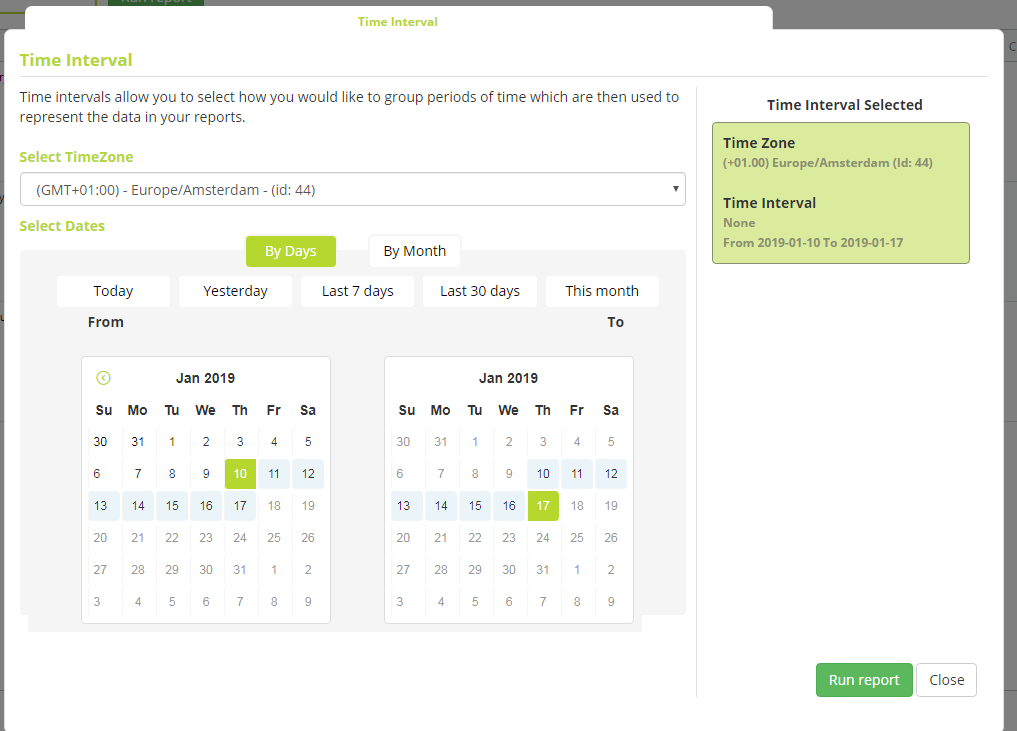
3. Click Select Date to define a time frame, granularity and time zone in which you want to view the data and hit the Run Report Button.
The Report is made up of 3 different panels, and provides you with the data regarding the time frame you have selected:
- TOTAL:it displays the Campaign KPI based on your Optimization Goal (CPA/CPI or CPC), the Budget spent and the total number of placements where the Optimizer is bidding for your ad campaign
- LEARNING: spending, placements and KPI data refer to the Optimizer’s learning phase
- OPTIMIZED: these data are relatedto the high performing placements (Optimized)
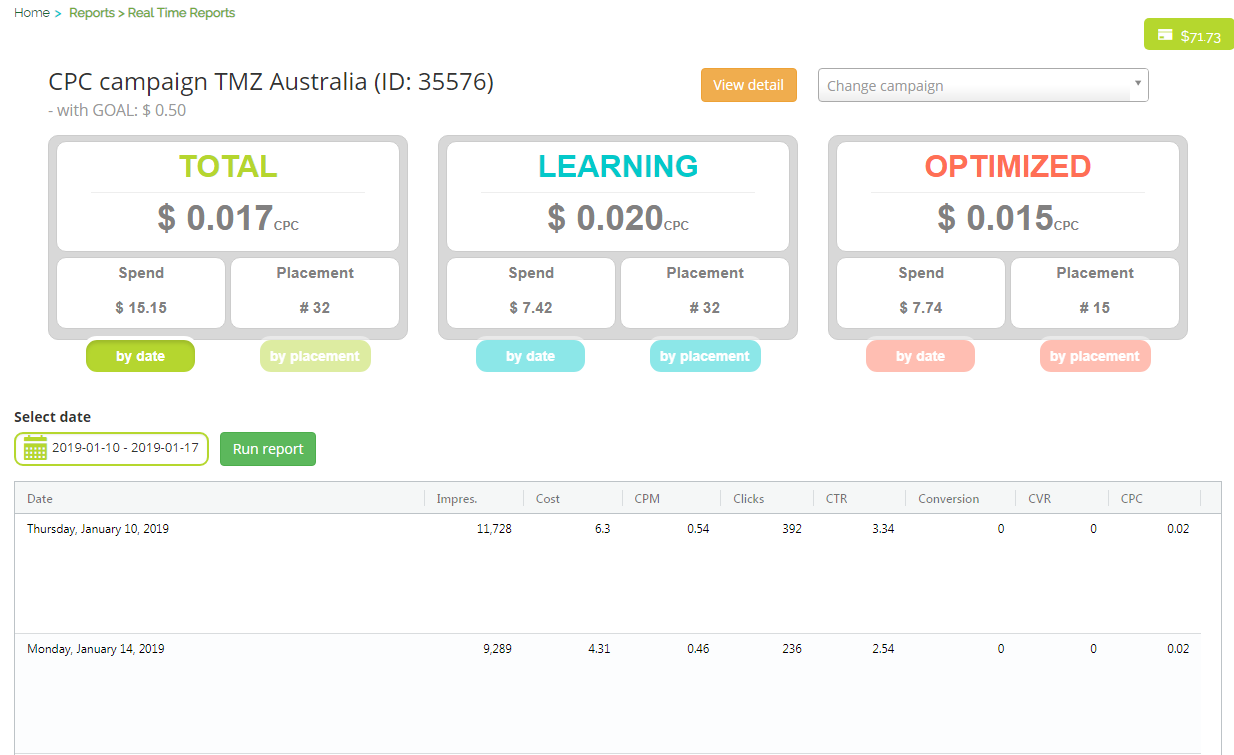
By clicking on the View detail button, you will get a pop-up containing the campaign’s details.
For each report (Total, Learning and Optimized) you are allowed to order the related data by date and by placement.
- By date:you will see the data (impressions, cost, CPM, Clicks etc) organized by day within the selected time frame
- by placement:the data are broken down by placement