Bucksense reports give you real-time data on your campaign parameters and can be easily customized to give you meaningful insights into their performance.
Report insights will help you to make decisions to optimize your campaigns based on the best performing variables and channels. For example, you can stop serving creatives that do not generate enough clicks and focus on other creatives that do drive more clicks and conversions.
To simplify data visualization, reports not only can be fully customized, but marketers can also choose among report types by key variable: offers, campaigns, countries, etc. The key variable of each type of report will be your reports first row from which you will be able to add all the campaign parameters that you want related to it.
How to View Reports
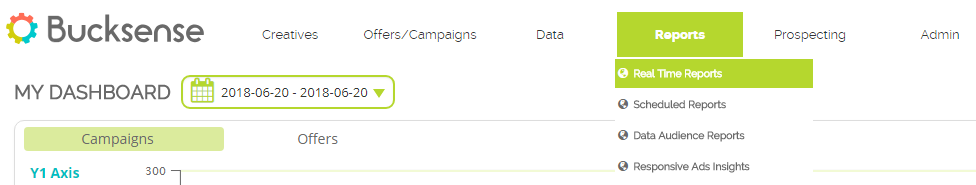
1. In the navigation bar, under Reports section, click on Real Time Reports.
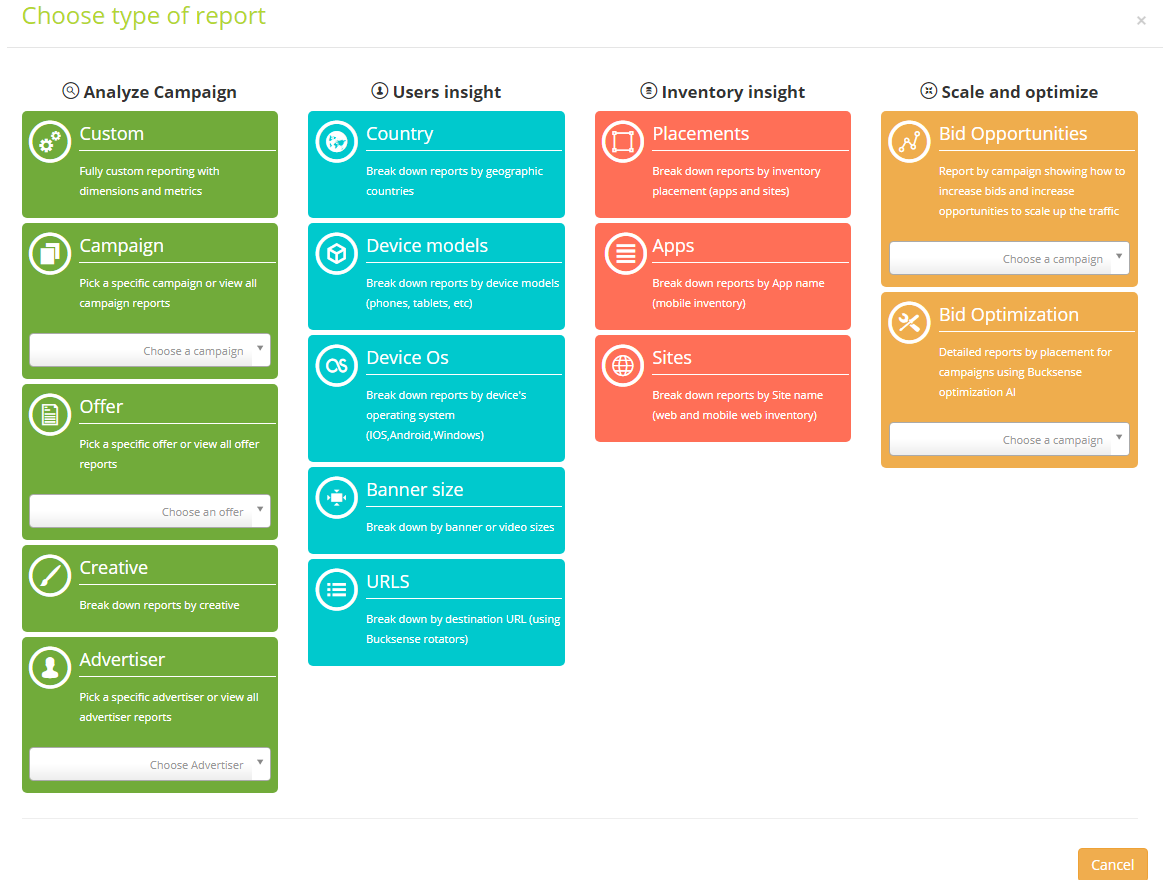
2. Choose the type of report, and, the related key variable between the following:
- Analyze Campaign: explore your report by Campaign, Offer, Creative, Advertiser or choose a fully Custom Reporting
- User Insight: break down your report by Country, Device models, Device OS, Banner Size or destination URLs
- Inventory insight: analyze the performance of your inventory (Placements, Apps and Sites)
- Scale and optimize: get detailed informations on how the Bucksense Optimizer is working through the Bid Optimization, or, find how increase your Bids Opportunities
In this way you can customize your report and break down it by different data (e.g creative, device models, placements etc).
This allows you to simplify the search for specific data.
Report Settings
Customize report settings and filters by: time range, time interval, dimensions and metrics. For further analysis, you can also export your customized reports.
Time Settings
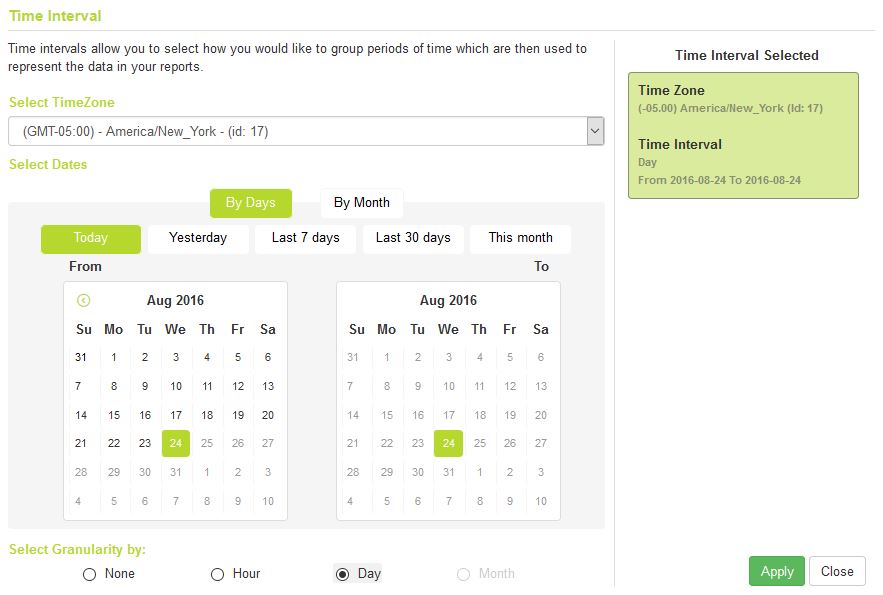
Click Select date to define a the period of time and the time zone you want to view your data. Under Select Granularity, choose how campaign data is displayed in report table: grouped by time interval or by hour, day or month.
Filters
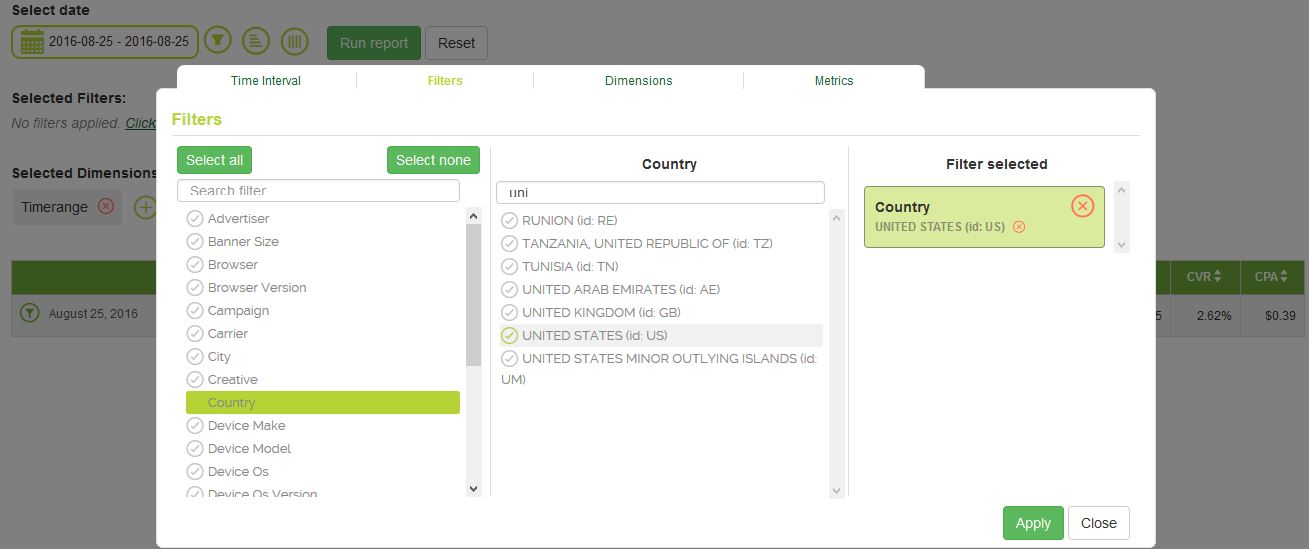
Filters ![]() allow you to search for specific data by multiple parameters: offer, campaign, device, country, etc.
allow you to search for specific data by multiple parameters: offer, campaign, device, country, etc.
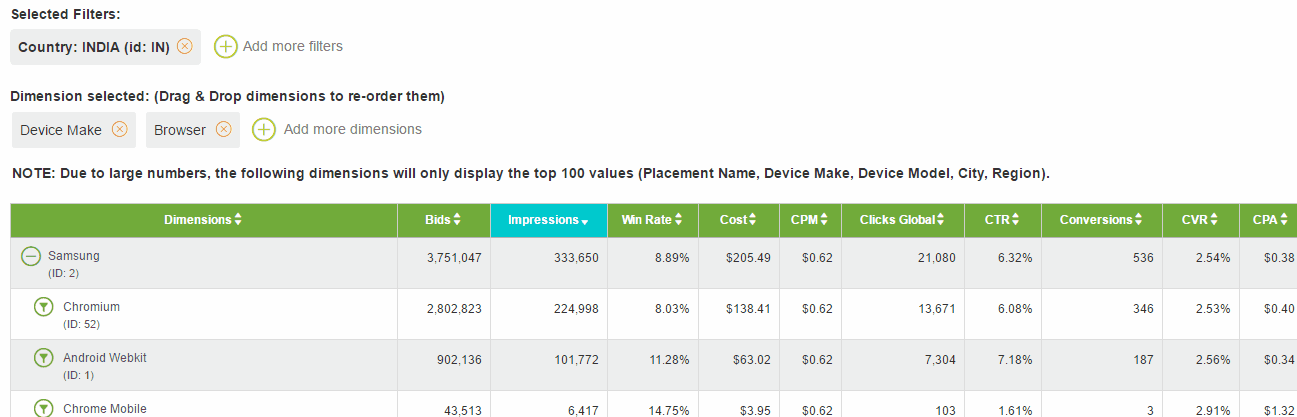
Dimensions
Dimensions ![]() allow you to break down your report by multiple different data points in a multi-dimensional formats: by city, country, browser, etc.
allow you to break down your report by multiple different data points in a multi-dimensional formats: by city, country, browser, etc.
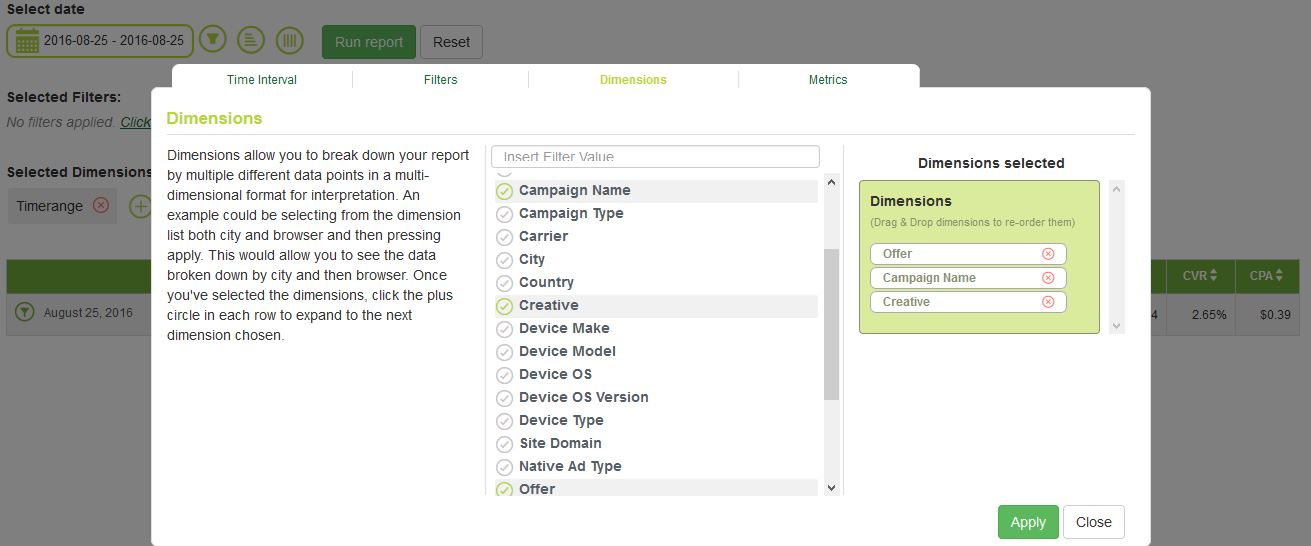
Select the dimensions that will help you to drill down data from your key parameters to as many targeting settings you want to relate with them to easily run a multi-dimensional analysis. For example, first select offer and campaign and then other targeting parameters set on the campaign that you want to relate with them (e.g.: creative, device, browser, etc.). Breaking down reports this way will give you a comprehensive view of your campaign performance to make decisions that enhance its optimization.
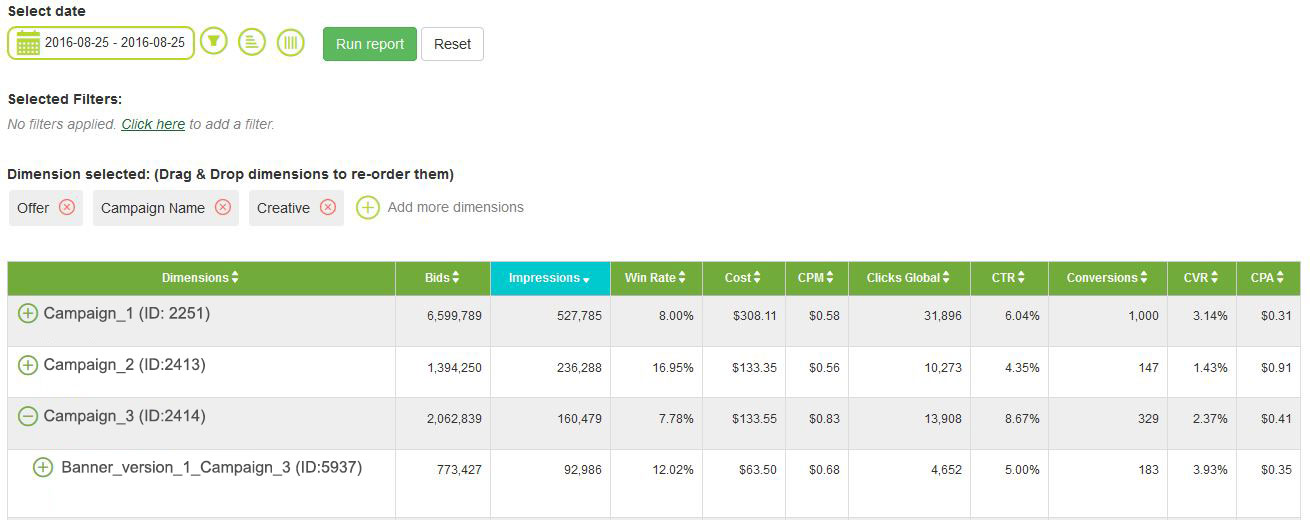
Dimensions appear on the grid by order of selection and they can be easily changed at any time moving the boxes on Dimension Selected.
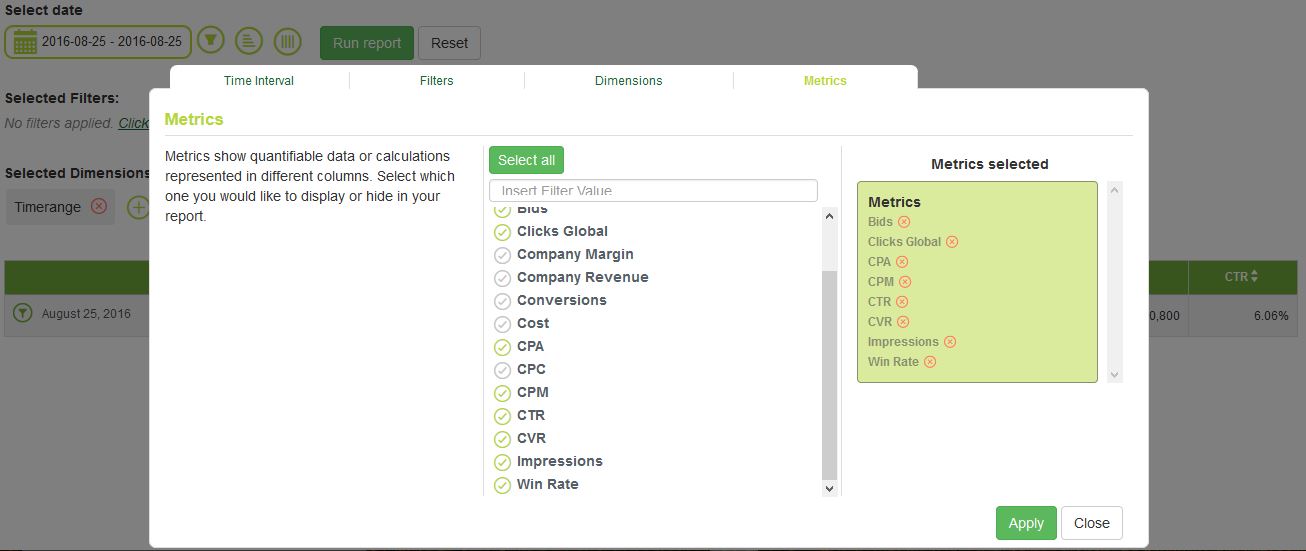
Metrics
Metrics![]() show quantifiable data or calculations represented in different columns. Select which one you would like to display or hide in your report. Add all metrics that are relevant for you to analyze your results.
show quantifiable data or calculations represented in different columns. Select which one you would like to display or hide in your report. Add all metrics that are relevant for you to analyze your results.
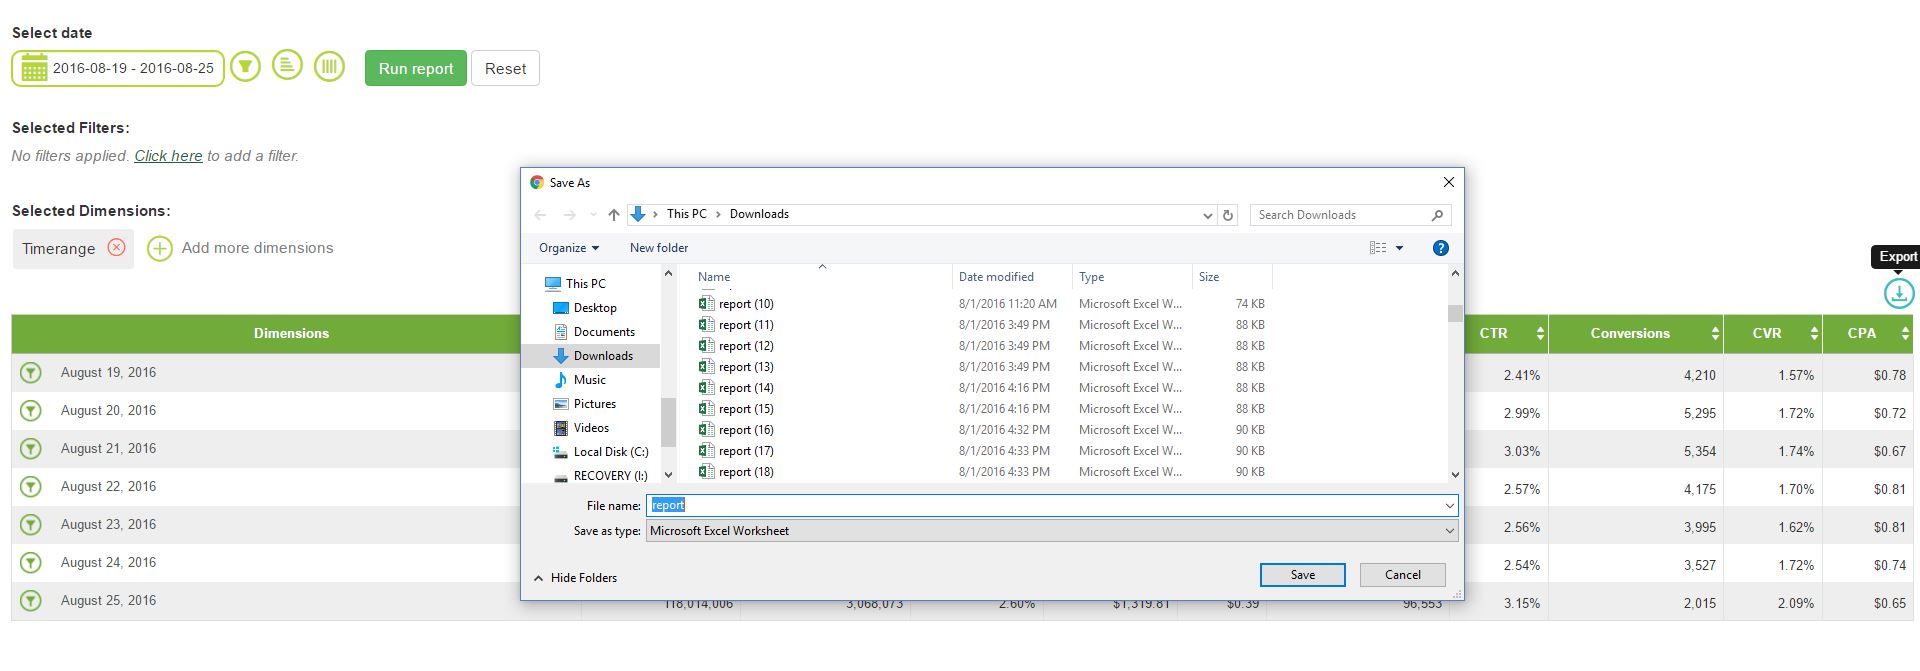
Export
Download and export ![]() your reports for further analysis and calculations.
your reports for further analysis and calculations.